Realized price: the average price coins last moved at
Realized cap divided by supply: the average price at which coins last moved on-chain.
TokenTrail turns the public ledger — blocks, wallets, fees, flows — into plain-English guides for complete beginners. Every figure is traced to a primary source, and nothing here is for sale.

Computed from Bitcoin Core’s 210,000-block halving interval and 50 BTC starting subsidy. Block heights are exact; calendar dates are not.
Crypto data comes from two very different places: trading venues, and the blockchains themselves. Most beginner mistakes start with mixing them up. Our library is organised around that split.
Prices, order books, futures and the behaviour of exchanges — information created by trading venues, not by the blockchain.
Sources: exchange and regulator documentation.
What the network itself records: blocks, transactions, fees, hash rate and staking.
What analysts derive from that record: cost basis, profit and loss, holder age and flows.
Sources: protocol documentation, client source code and metric authors.
Read it your way: guides, the metrics library, the glossary or the calculators.
Each profile explains one indicator: the formula in words, who introduced it, how analysts read it, and the specific ways it misleads.

Realized cap divided by supply: the average price at which coins last moved on-chain.

Market cap divided by realized cap: how far today’s value sits above or below on-chain cost.

Net paper profit or loss of all coins as a share of market cap — above zero, the network is in profit.

Value of coins when spent divided by their value when created: above 1, spenders realize profit.

Bitcoin’s supply split into age bands by when coins last moved — a picture of holding and spending.

How much proof-of-work miners perform per second — estimated, never directly observed.

Today’s dollar value of newly mined bitcoin divided by its one-year average — a gauge of miner income.

Coins sent to labelled exchange addresses minus coins withdrawn from them — only as good as the labels.

Bitcoin’s market cap divided by the market cap of tracked stablecoins — a rough gauge of dollar “dry powder”.

The periodic payment between longs and shorts that keeps perpetual futures near spot — a gauge of positioning.
All 16 metric profiles · each with sources and limits.
Ten guides in a fixed order take you from “what is a block?” to sizing a position you can live with. No sign-up, no paywall, no course to buy.

What a blockchain is, how a transaction moves, and how to keep keys safe.
Start step oneVolatility, position sizing, DCA and the scams aimed at newcomers.
Investing basicsCost basis, holder cohorts and flows — and where those charts mislead.
On-chain analysisLong-form explainers on blockchains, markets and risk. Each one opens with a 50-word answer, cites its sources line by line, and ends with the mistakes beginners make most.


Every 210,000 blocks the number of new bitcoins created per block is cut in half. Here is the rule, the arithmetic behind the cap, and the claims about halvings you should treat with care.

Volatility is how far and how fast a price moves. In crypto it is large, but it is only one of several risks. Here is how volatility is measured, why it is so high, and how to prepare for it before you invest.
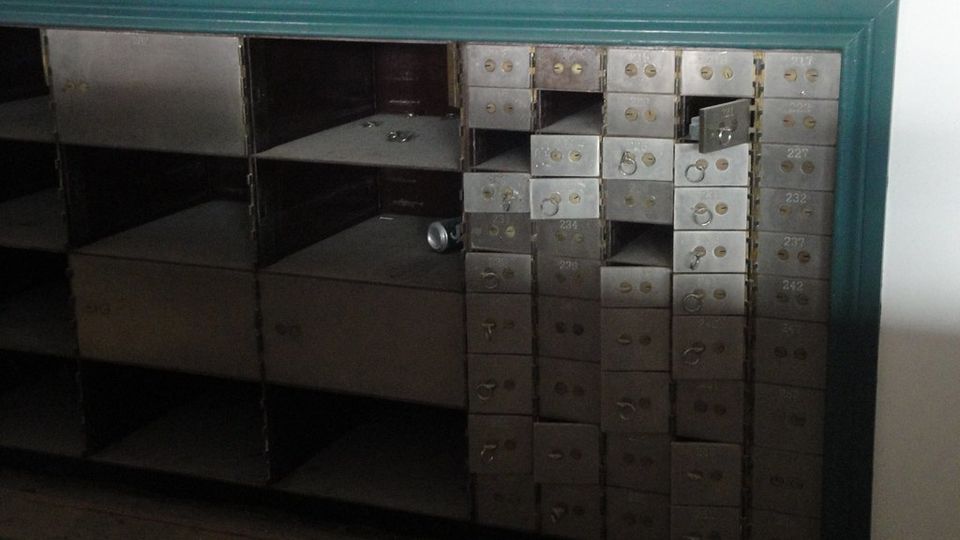
With a custodial account a company holds the keys and you trust it. With self-custody you hold the keys and carry the responsibility. Here is what changes, risk by risk.

On a spot market you buy the coin itself. On a derivatives market you trade a contract whose value follows the coin’s price. That one difference changes what you own, what you can lose and which costs you pay.
Search 109 pages of guides, metric profiles and glossary entries. Press / anywhere on the site.
Figures come from protocol specifications, client code, regulators and original metric authors — never from another blog’s summary.
Before publication, a separate fact-checking pass that did not write the page re-checks every number, date and rule against its source.
No affiliate links, no sponsored posts, no token promotions, no ads. We earn nothing when you buy anything.
Each page opens with a 50-word answer and defines every term the first time it appears.
Every metric profile ends with how it misleads. If a chart cannot tell you something, we say so.
Long-form guides on blockchains, markets, investing risk and security, each with sources and common mistakes.
Browse the guides
Profiles of the indicators analysts quote most, with formulas, original authors, worked examples and limits.
Open the library
Calculators for averaging in, sizing positions, cost basis and drawdowns — each shows its formula.
Use the calculators